CASH
FLOW and GANTT CHARTS

Generally
EstimatorVJ
now contains the facilities to manage automatic generation of Cash Flow
and Gantt Charts. An example of each is shown below.
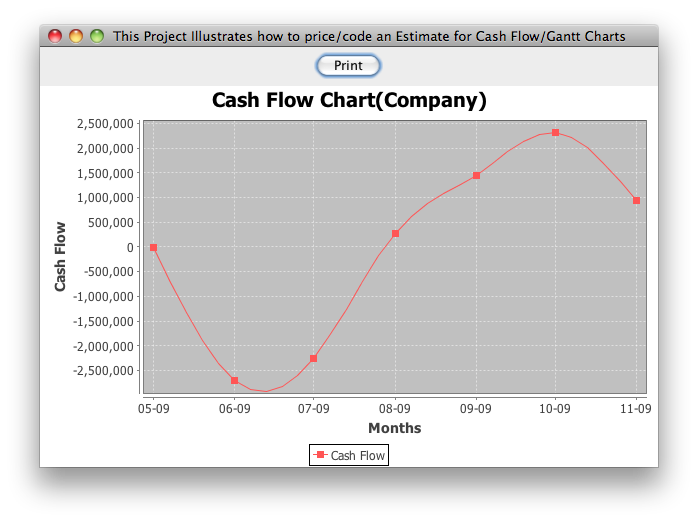
Company
Cash Flow
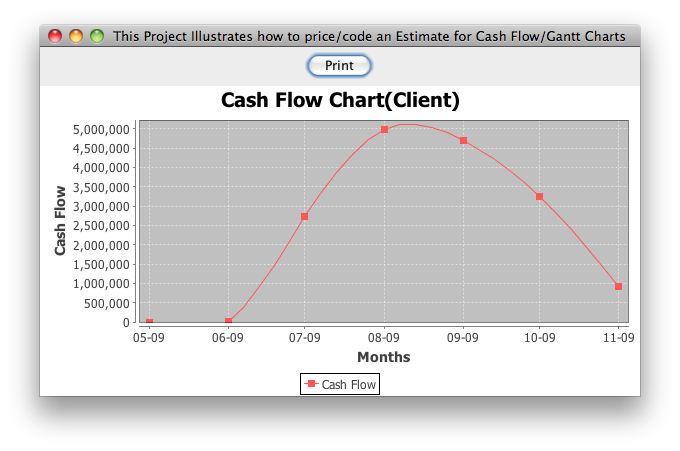
Client
Cash Flow
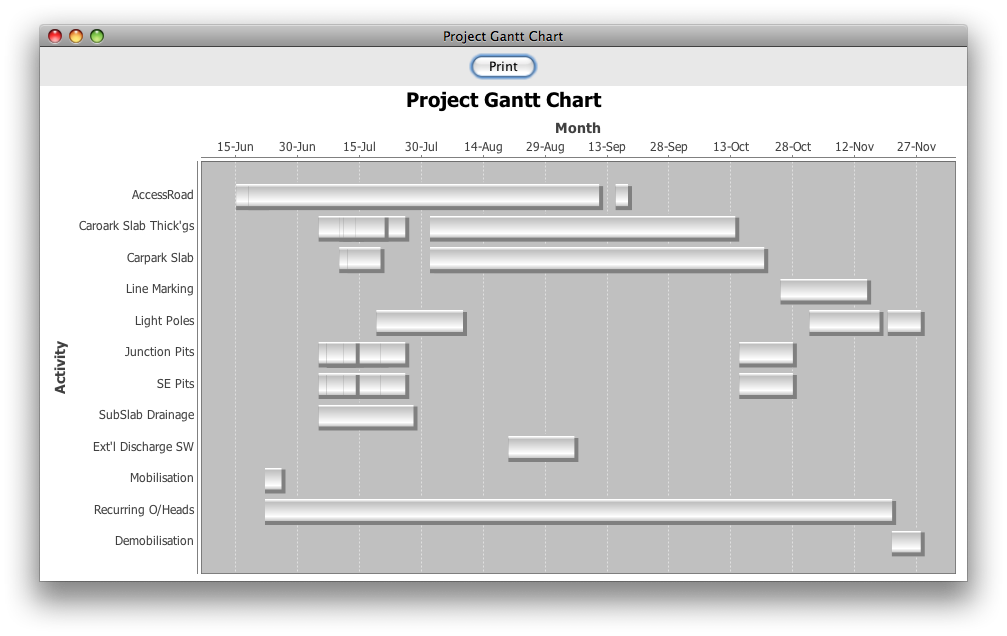
Gantt
Chart
The Project worksheets must contain the following three columns for
generating a Cash Flow Chart:
plus a column headed 'Activity' for generating a Gantt Chart.
These columns are used to hold respectively
- The construction start date of the Cost item in the format
‘dd/mm/yyyy’
e.g. 2/10/2009
- The construction duration in days to carry out the work of the Cost
item
OR
- The construction date in which the work will end
- The name of the Activity to be listed in the Gantt Chart
NOTE: Only one of the Duration and End column entries is required. The other
entry will be calculated.
The
Project Template ‘StandardCashFlowGantt’ can be downloaded from our
website using the option ‘System->Templates’. This Template already
has the appropriate columns added for your convenience.
If you already have created and worked on a Project without these columns,
you can ADD these columns in - see the Topic Adding
a New Column.
Procedure
1.
Create the Project
Create
the project using the 'StandardCashFlowGantt' Project
Template. If you don't see it in the list of Templates, then you can
add it by clicking the 'System->Templates' button and choosing
it from the list of Templates we maintain on our Web Server.
2. Measure and Price the project in the normal way, but
noting that:
- any
cost item which involves more than one construction DATE or more than
one ACTIVITY code, should be broken down into separate items within a
Rate or Cost workup sheet and each of those items coded accordingly
- examples of DATE/ACTIVITY coding is illustrated later
3. Code the estimate
Code
the estimate with the 'Start' and 'Duration' /'End' dates if a Cash
Flow Chart is required, plus enter the associated 'Activity' if a Gantt
Chart is required.
- Every cost item must be coded
If a
Cost item has a Cost/Rate build up, and the cost items within the
buildup have different coding requirements, then the coding
should be done in the Workup Sheet, and the parent item not
coded
If
a Cost item has a Cost/Rate build up, and the item is coded at the top
level, then the cost items within the Workup Sheet will not be used
for
developing the charts.
- The end date must be later than the start date
- If a Duration AND End dates are entered, the Duration will be
calculated from the End date
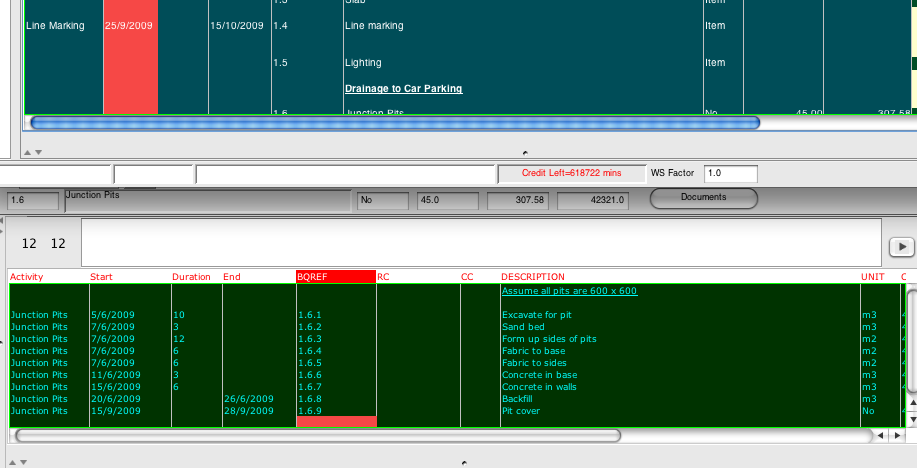
Here
is an example of the coding of two items in an Estimate. One is coded
at the parent level, the other at the Workup Sheet level.
4. Display the Chart
- Choose the 'Project->Print' option
- Choose the 'Special' report TAB
- Choose the Cash Flow or Gantt report
If you have chosen the Cash Flow Chart, then the Cash Flow Options
will be displayed
- Company Cash Flow shows the Contractor's Cash Flow
- Client Cash Flow as seen by the Client
- Show Chart displays a graphical representation of the Cash Flow
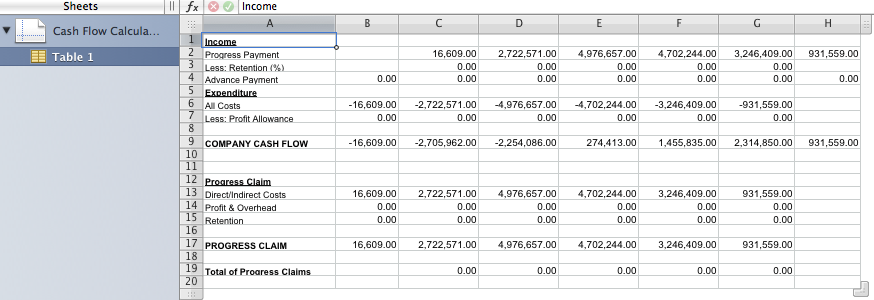
- Create XLS Report will generate a 'Cash Flow Spreadsheet' and place
this in the Project's Documents folder
You can open this by simply clicking on the 'Documents' button in
the project Window.
Here is an example of the Company Cash Flow.
- Exclude OH Distributions
When
the Cash Flow data is collected from the Estimate, EstimatorVJ will by
default collect all overhead distributions, money re-assignments,
markups, etc.
Ticking this option overrides the Overhead and only
Overhead distributions, thus giving you the ability to nominate the
time periods you want the General Overheads to be assigned to
- At Summary Level
If this is ticked, then the Cash Flow will be generated based on and
only on the dates applied in the Project Window
- Profit Options
- 'As % of CashFlow'
- Calculates profit as a percentage of the CashFlow using the
value in 'Using' as the percentage
- 'Incl in Cost'
- Tick this option if the Project Costs include the Profit
- 'Calculated from 'CC' code
- The
total Profit allowance is included in the Project Costs and is
labelled
using the 'Cost Category Code' entered in the 'Using' field
- 'As Lump Sum'
- Tick this option if the Project Costs include the Lump Sum value
entered into the 'Using' field
- 'Show Separately'
- If this is ticked then the Graph shows the Profit represented
separately
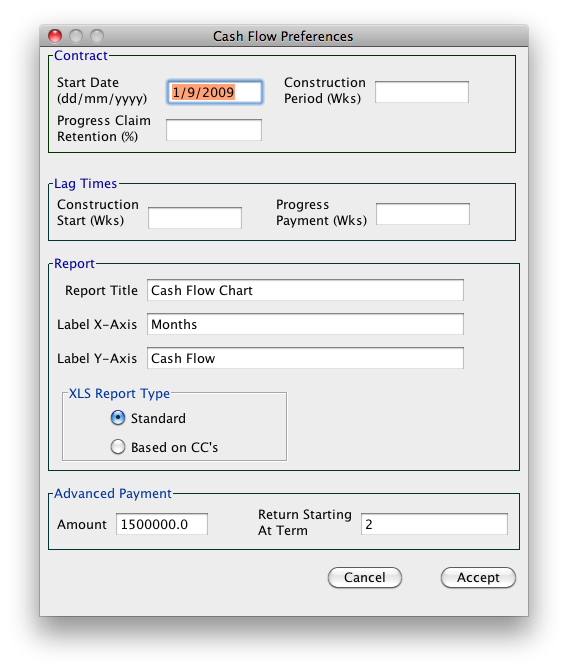
- Edit Cash Flow Preferences displays this dialog
The only entries that are used by the program AT THE MOMENT are:
- Retention %
This is the amount the client will deduct from the Contractor's
monthly progress claim
- Report Title
- Label X-Axis
- Label Y-Axis
- Advanced Payment Amount
An initial Cash Advance to the Project to reduce the front end Cash
Flow Deficit
- Return Starting at Term
The Month at which the Advanced Payment Amount is retrieved back
from the Project
5. Print the Chart
When the Chart is displayed, there
is a 'Print' button available to send the chart to the printer if
desired