Generally
Custom Reports allows the Estimator to measure and price the Estimate in the manner he feels is most efficient, then Print it in a different arrangement according to Groupings.
An Example of this is where a Project is measured in Elements (such as Substructure, External Walls, External Windows & Doors, Roof, etc) but printed in 'Trade' Groups.
This is accomplished by adding a column to the project into which the Group Codes (in this case Trades) are entered, thus denoting which items belong to which Trade, then creating/defining the Custom Report, and finally Printing the Custom Report.
A second column can also be added and used to breakdown/group the first level items into a second level of Groups - e.g. Functional Areas.
Method
The following example will show each of the steps needed to create an Estimate in Elements, then create a Custom Report to Print this Project organized into the Groups 'Tenancy Areas' and 'Functional Spaces'.
The example we use will define three Tenancies:
Coles
BigW
Target
and define four Functional Spaces
Sales
Circulation
Amenities
Com
We are limiting our scope here, however the Program can accomodate as many items of each Group as you wish, however these reports can only have a maximum of two Groups.
Step 1 - Create the Estimate
Use an appropriate Template to Create the New project - once we have set this project up and Created the Custom Report, we can then save this as a Template, and the Custom Report will then be automatically available on the next Project should it be of a similar nature.
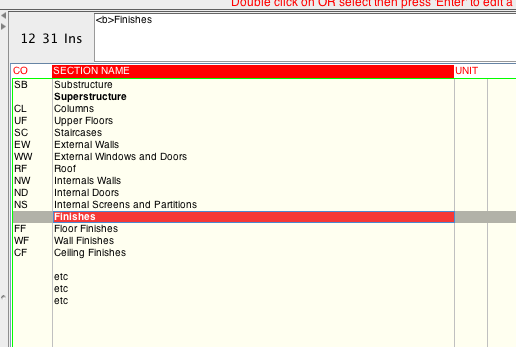
Here is the layout of the Sections ('Elements') in this Example project:
Step 2 - Add the Coding Columns
Add two columns, in this example, 'Tenancy' and 'FA', to EACH of the Default worksheets Estimate Worksheet, QTY Worksheet, RATE and COST Worksheets. These are the columns which will receive the appropriate Group codes. We add them to the QTY Worksheets as well because a lot of items are going to contain measurements spanning over multiple Tenancies and Functional Spaces.
Step 3 - Measure and Price the Estimate
Measure and price the estimate in the normal manner,
BUT:
- items which encumbrance more than 1 of the Group codes,
and need to be quantified, must have each of their quantities
kept separate for appropriate coding. There are a couple of techniques
to expedite this and will be demonstrated in the next step
- items which encumbrance more than 1 of the Group codes, but don't need to be quantified, must be broken down into the cost for each Group and subGroup. Again, an example will be shown in the next step on how to achieve this.
The Custom Reports and their options are accessed by:
- Opening the Project
- Clicking the Print button
- Clicking the Special TAB
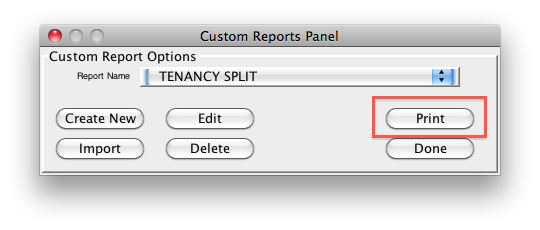
- Clicking the Custom Report button
- Click the 'Create New' button
- Enter a Relevant name for the Report
e.g. Tenancy Split - Click the 'Edit' button to define this Report
- Edit the Details for this Report
- Enter any descriptive text
- Click on the 'Code 1 Column' combo box and choose the column which will contain the Group 1 (Tenancy) codes
- If you need to break the first Group down into Group 2 codes (FA)
- Click on the 'Code 2 Column' combo box and choose the column which will contain the Group 2 (FA) codes
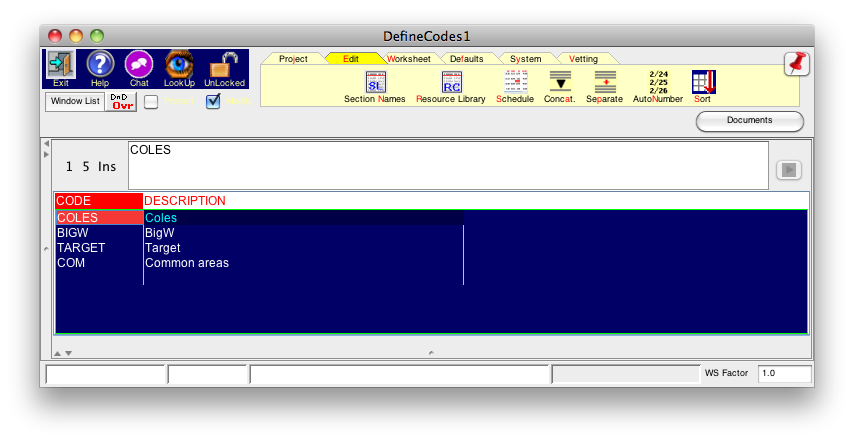
- Click the 'Define' button against each of these Groups and
specify the Valid codes and their names for each of the members of each
group.
Here is an example for the Group 1 codes (Tenancy):
Do the same procedure if you need Group 2 breakdowns as well - Click done to complete this yask and you are taken back to the previous options
- Click 'Done' - we need to code the Estimate now before going further and printing.
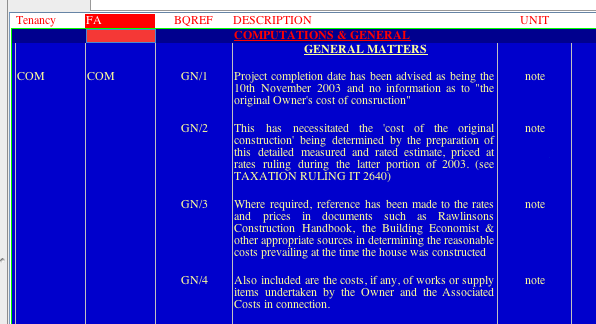
- Items which belong to 1 of the Groups
- when this is the first item to be coded in a Section
- place the appropriate Group codes in the appropriate columns depending upon whether you are using 1 or two groups
- when this is not the first item to be coded in this Section
- you only have to enter the code for each Group if and only if it's code is different from the previously coded item
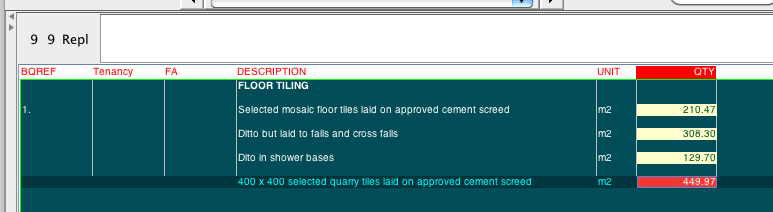
Below is an excerpt from a Section showing an example of this:
- Items which belong to more than 1 of the Groups
- Items which need to be quantified
- place the appropriate Group codes in the appropriate columns depending upon whether you are using 1 or two groups
Here is an example of such a case in a Quantity workup sheet.
The cost items:
The quantity worksheet for item '1.':
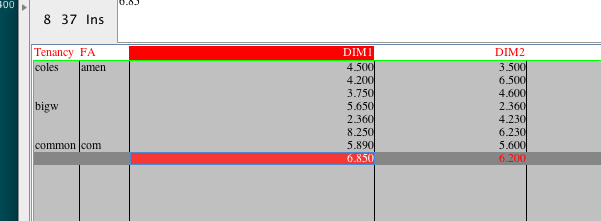
Since coding is done here, they will over-ride any coding done at the higher level.
The fist three items are associated with 'coles'; the first 6 items get associated with the 'amen' FA group.
So, coding is most effectively done by working down each group's column 1 at a time, putting the appropriate on the first line, then moving down to the next line which changes in code, placing that in the worksheet, then continuing on down.
Once you have finished entering codes for the first group, then do the same in the second group column.
Step 4 - Printing The Estimate
Click the Print button
and the program will run through the Entire estimate and 'collect' the appropriate data.
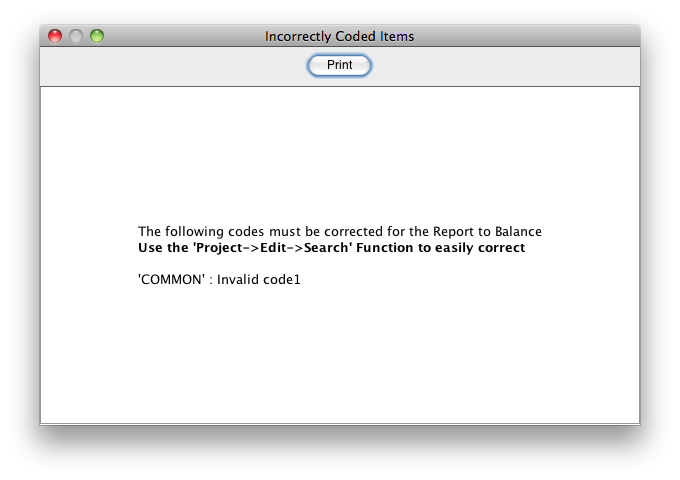
If any errors are encountered in the coding, an Error listing will be created and shown so that you can correct them.
NOTE: Even though errors may exist, the Report will still be presented after the Error Listing is displayed.
These errors should be fixed to make sure that the resultant Report is correct.
The Report will be presented in Preview mode, with the option to 'Print ALL' the pages if satisfied.
Here is an example of an error listing: