
ON-SCREEN MEASURING
Quick Index
Generally
The On-screen measuring facility in EstimatorVJ allows you to measure quantities directly off drawings while they are displayed on your monitor.
The formats of drawings supported by VJ include PDF, JPEG, PNG, and GIF.
All measuring is done by 'marking' the dimension using the mouse to click on the drawing at the end points of the dimension. Once all points have been clicked, VJ will calculate the result and enter the result into the appropriate Worksheet cell. Each dimension can be annotated by simply typing the annotation prior to completion of clicking the last end point.
Each time a dimension is 'marked', the drawing is COLOURED in with the currently selected colour in an appropriate manner commensurate with the type of measure.
Currently there are five types of 'measures'
Markings can be removed at any time from the drawing, with the corresponding entry in the worksheet also being deleted.
All 'marked' drawings are saved within the Project, and subsequently saved with it when backups are made.
The Components of On-Screen Measuring
After you have chosen a drawing to measure, your monitor will display the following two areas filling your screen:
The Control Panel:

This panel controls various aspects of the 'marking' and contains many convenience controls:
Here is a detailed look at each of the controls:
 Close the current drawing
 Change drawing
access to another user. Initially when using drawings, you
are restricted to drawings YOU have imported.
Change drawing
access to another user. Initially when using drawings, you
are restricted to drawings YOU have imported.
Clicking this button and providing another USER name, you can access their drawings.
 Preferences options
Click this to choose how certain things look/work in the drawing measures.
The following dialog will appear:
 magnifying glass : a magnified area of the image
immediately under the cursor, superimposed with a
crosshair for accuracy
magnifying glass : a magnified area of the image
immediately under the cursor, superimposed with a
crosshair for accuracy
 a
slider to increase/decrease the magnification of the
magnifying glass
a
slider to increase/decrease the magnification of the
magnifying glass
 Zoom In
button:
Zoom In
button:
 Zoom Out
button:
Zoom Out
button:
 Select from another
drawing
Select from another
drawing
 Select
'Colour of Measurement Marking'
Select
'Colour of Measurement Marking'
 Print
this drawing and measurement markings
Print
this drawing and measurement markings
 Click this to
incrementally move UP the drawing
Click this to
incrementally move UP the drawing
RIGHT click this to set the top edge of the image at the top boundary of the drawing
 Click
this to incrementally move DOWN the drawing
Click
this to incrementally move DOWN the drawing
RIGHT click this to set the bottom edge of the image at the bottom boundary of the drawing
 Click this to incrementally move LEFT on
the drawing
Click this to incrementally move LEFT on
the drawing
RIGHT click this to set the left edge of the image at the left boundary of the drawing
 Click this to incrementally move RIGHT
on the drawing
Click this to incrementally move RIGHT
on the drawing
RIGHT click this to set the right edge of the image at the right boundary of the drawing
 Click this to CENTRE
the Drawing
Click this to CENTRE
the Drawing

Click this to expose the 'Constants'
controls.
Click this to hide them.
The Drawing:

Each drawing imported into the Project is initially shown as an image in either actual or scaled size in a window (drawing) occupying the full screen.
Multiple Monitors:
If you have more than one monitor connected to the computer, you will be asked to nominate which monitor the drawing is to be shown on. This occurs once only for each EstimatorVJ session.
The Procedure:
Constant Width Depth or Factor
Certain circumstances require repeatedly measuring lengths and/or areas and applying a constant width and/or depth and/or factor (No. of) to these measurements.
e.g. Concrete slabs of a constant thickness
Strip footings of a constant width and depth.
These circumstances are accounted for by:

The On-screen measuring facility in EstimatorVJ allows you to measure quantities directly off drawings while they are displayed on your monitor.
The formats of drawings supported by VJ include PDF, JPEG, PNG, and GIF.
All measuring is done by 'marking' the dimension using the mouse to click on the drawing at the end points of the dimension. Once all points have been clicked, VJ will calculate the result and enter the result into the appropriate Worksheet cell. Each dimension can be annotated by simply typing the annotation prior to completion of clicking the last end point.
Each time a dimension is 'marked', the drawing is COLOURED in with the currently selected colour in an appropriate manner commensurate with the type of measure.
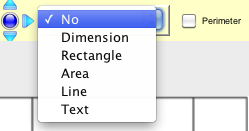
Currently there are five types of 'measures'
- Length
- Rectangle
- Area
- Perimeter
- Scale
- Line
Use this to simply draw a line which can help in 'closing' the boundary of a bounded area - Comment
Use this to annotate a drawing
- <length> (in DIM1) for Length
- <length> (in DIM1) and <width> in DIM2 for Rectangle
- <length> + <width> (in DIM1) and <2> (in FACTOR) for Rectangle Perimeter
- <area> (in DIM1) for Area
- <perimeter> (in DIM1) for Area Perimeter
- <none> for Scale - this result is stored with the coloured drawing when closed
- <none> for Line
Markings can be removed at any time from the drawing, with the corresponding entry in the worksheet also being deleted.
All 'marked' drawings are saved within the Project, and subsequently saved with it when backups are made.
The Components of On-Screen Measuring
After you have chosen a drawing to measure, your monitor will display the following two areas filling your screen:
| The CONTROL PANEL |
| The DRAWING |
The Control Panel:
This panel controls various aspects of the 'marking' and contains many convenience controls:
- the type of mark
- length
- rectangle
- area
- perimeter
- the colour of the mark
- a display of the current mark's annotation
- the vertical and horizontal scaling factor
- a button to select a different drawing
- a magnified view around the cursor for accurate marking
- a slider next the the magnified view enabling the user to adjust the amount of magnification
Here is a detailed look at each of the controls:
Close the current drawing
Change drawing
access to another user. Initially when using drawings, you
are restricted to drawings YOU have imported. Clicking this button and providing another USER name, you can access their drawings.
Preferences optionsClick this to choose how certain things look/work in the drawing measures.
The following dialog will appear:
Choose
the Line type you want - solid, dots, or dashes
Click on the 'Width' combo box and choose how wide you want lines to be
Slide the 'Opacity' slider to select how 'strong' the line is to be - sliding to the left allows the image under the line to 'show through' more - to the right and the image 'shows through' less
Tick 'Show Tags;, and any TAG you have added to a measurement will show
Tick 'Show Distance Meter', and a small window will appear in top right of the drawing showing distances of the current cursor position from the last 'mark' during measuring
Tick 'Request TAGs',
and every time you make a measurement, a dialog will
appear asking you to enter the TAG. TAGs can span
multiple lines, each line being separated using the
'ENTER/RETURN' key
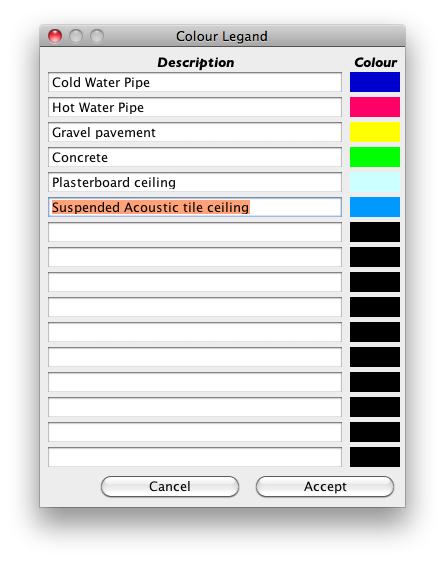
Click on the 'Colour Legend' button to bring up a dialog whereby you can create up to 16 colours, each with a description, for choosing from when clicking the
'Colour of Measurement Marking' (see below). Here is an example of a Colour Legend:
Click on the 'Colour Legend' button to bring up a dialog whereby you can create up to 16 colours, each with a description, for choosing from when clicking the
'Colour of Measurement Marking' (see below). Here is an example of a Colour Legend:
magnifying glass : a magnified area of the image
immediately under the cursor, superimposed with a
crosshair for accuracy
a
slider to increase/decrease the magnification of the
magnifying glass
Zoom In
button:click with LEFT mouse
button, and it increases incrementally the image
click with the RIGHT mouse button, and it magnifies current image by 2
click with the RIGHT mouse button, and it magnifies current image by 2
Zoom Out
button:click with LEFT mouse
button, and it decreases incrementally the drawing
click with the RIGHT mouse button, and it returns the drawing to it's initial size
click with the RIGHT mouse button, and it returns the drawing to it's initial size
Select from another
drawing
Select
'Colour of Measurement Marking'Click this to choose
either
directly from a Colour
Pallette, OR
from the Colour Legend which appears as a menu list, as shown below:
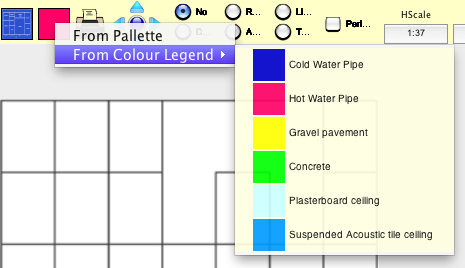
from the Colour Legend which appears as a menu list, as shown below:
Print
this drawing and measurement markings
Click this to
incrementally move UP the drawingRIGHT click this to set the top edge of the image at the top boundary of the drawing
Click
this to incrementally move DOWN the drawingRIGHT click this to set the bottom edge of the image at the bottom boundary of the drawing
Click this to incrementally move LEFT on
the drawingRIGHT click this to set the left edge of the image at the left boundary of the drawing
Click this to incrementally move RIGHT
on the drawingRIGHT click this to set the right edge of the image at the right boundary of the drawing
Click this to CENTRE
the DrawingClick the button to select
the current measuring mode. The 'No' mode is set each
time you execute a 'Set Scale' or 'Select Drawing'
option
The 'Perimeter' button is a checkbox and modifies the characteristics of the Rect and Area functions to measure the Perimeter of the respective shape.
This measurement type draws a dotted outline around the shape's perimeter to differentiate from other types.
The 'Perimeter' button is a checkbox and modifies the characteristics of the Rect and Area functions to measure the Perimeter of the respective shape.
This measurement type draws a dotted outline around the shape's perimeter to differentiate from other types.
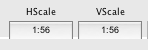
Click the HScale button to
determine the scaling factor. You will be required to
click the end points of a known HORIZONTAL length, then
input that length.
NOTE: This also sets the VScale to the same value.
If the Horizontal and Vertical scales are different, then after setting the Horizontal scale, click the VScale button then do the same for a known Vertical length.
NOTE: This also sets the VScale to the same value.
If the Horizontal and Vertical scales are different, then after setting the Horizontal scale, click the VScale button then do the same for a known Vertical length.
You can comment each
measurement by simplying typing the comment while the
drawing is active. You will see your comment being
entered into this control as you type. You must type the
comment BEFORE marking the measure. This comment
will be placed into the COMMENT column on the same line
as the measurement in your currently selected
worksheet. After the measurement has been handled, the
current comment will be erased.
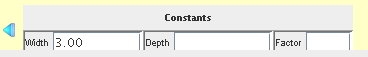
Click this to expose the 'Constants'
controls.
Click this to hide them.When this control is visible and only when
visible, each time a measurement is registered
in the worksheet, the measurement is suffixed
with '* Width * Depth' and '* Factor'. Click inside
the Width,Depth, or Factor text box to enter/change it's
details.
The Drawing:
Each drawing imported into the Project is initially shown as an image in either actual or scaled size in a window (drawing) occupying the full screen.
Multiple Monitors:
If you have more than one monitor connected to the computer, you will be asked to nominate which monitor the drawing is to be shown on. This occurs once only for each EstimatorVJ session.
- Technical Information
- When more than 1 monitor is ATTACHED
(even if they are not powered
on), the computer's graphics system
creates a Coordinate pane encapsulating all
ATTACHED monitors (**even if they are not powered
on**) as depicted below

- When VJ saves any Worksheet/Window, it also saves
it's location within the
coordinate pane (NOT the location within the
displaying monitor) so if THE monitor which would be
displaying the Worksheet/Window is connected but not powered on,
VJ will not know this and
the Worksheet/Window will open in the coordinate space
and position where it was last closed, and
consequently not appear.
On the other hand, if the monitor that would normally show this Worksheet/Window is disconnected, (or doesn't exist), VJ will know this and NOW move it to the prime monitor and show it
- The consequences to the User
- e.g. If moving a Project from one computer with
multiple monitors to another computer with a
single/multiple monitors, all windows will
automatically be adjusted to show on the primary
monitor
The Procedure:
Understanding thebutton or (CTRL+ENTER)
- It's action depends on which worksheet type is clicked:
- A QWUS:
- This is the only worksheet type which stores a
DRAWING
If no drawing has been previously used, then the user is requested to choose one, which then gets stored in this worksheet, and opened
If a drawing has been previously used in this worksheet, then it will automatically get opened - Any other worksheet type:
- If this worksheet type does not contain a QTY column, then nothing will happen
- If this worksheet type does contain a QTY column
- If the QTY column already contains a QWUS,
then it is opened, otherwise a new QWUS is
created and opened
In either case, once the QWUS is opened, thebutton is automatically clicked without
user interaction and the above rules applied
- Open the worksheet to receive the measurements; in this example we will start in an Estimate Worksheet
- Select the item to receive the first measure.
This item must not have a direct entry in the QTY cell, as the program will either attempt to open an exiting QTY Workupsheet, or create a new one.
Subsequent measures will be placed on following inserted lines in this workupsheet. - Press the CTRL+ENTER key combination OR click - this starts the measuring process
- A File Dialog will show, requiring you to select an
existing Measurement
Drawing.

The first time this feature is used in a Project, the list will be blank, therefore you will need to click the 'Drawings' button at the bottom.
- Navigate to and Open the drawing you wish to add to
the Project.
Supported file types at the moment are limited to PDF, PNG, JPEG, GIF.
- Having selected an appropriate Drawing, the Drawing is
copied into the Project, and a Measurement file is
created which maps a Canvas upon which all your
measurements are done.
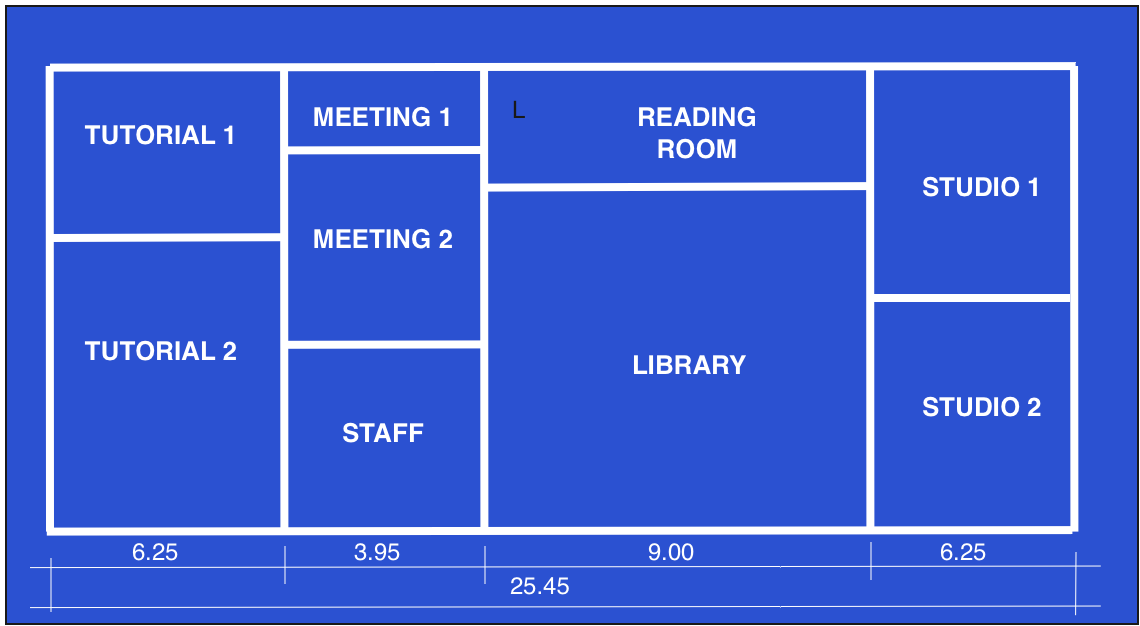
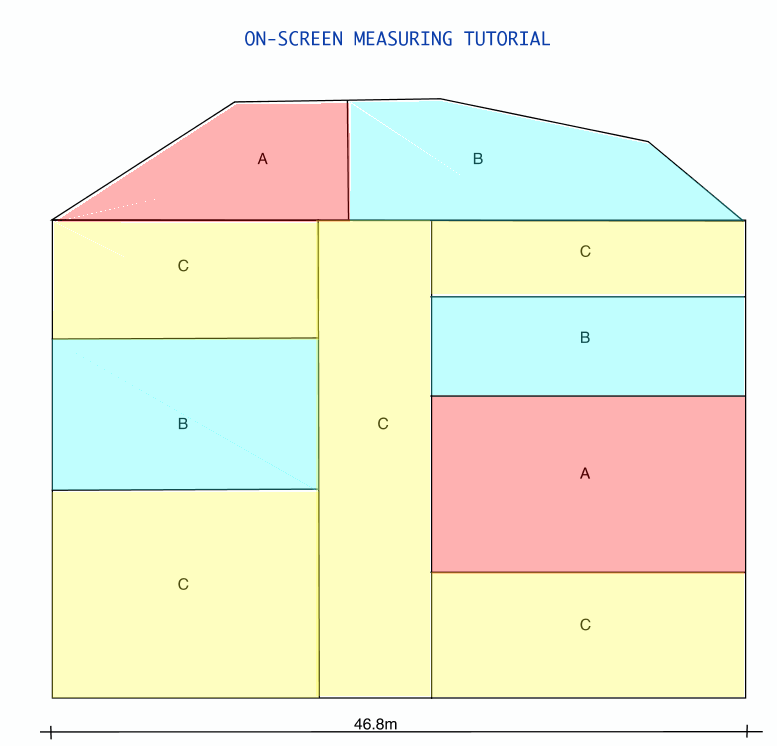
Here is an example after executing this step:
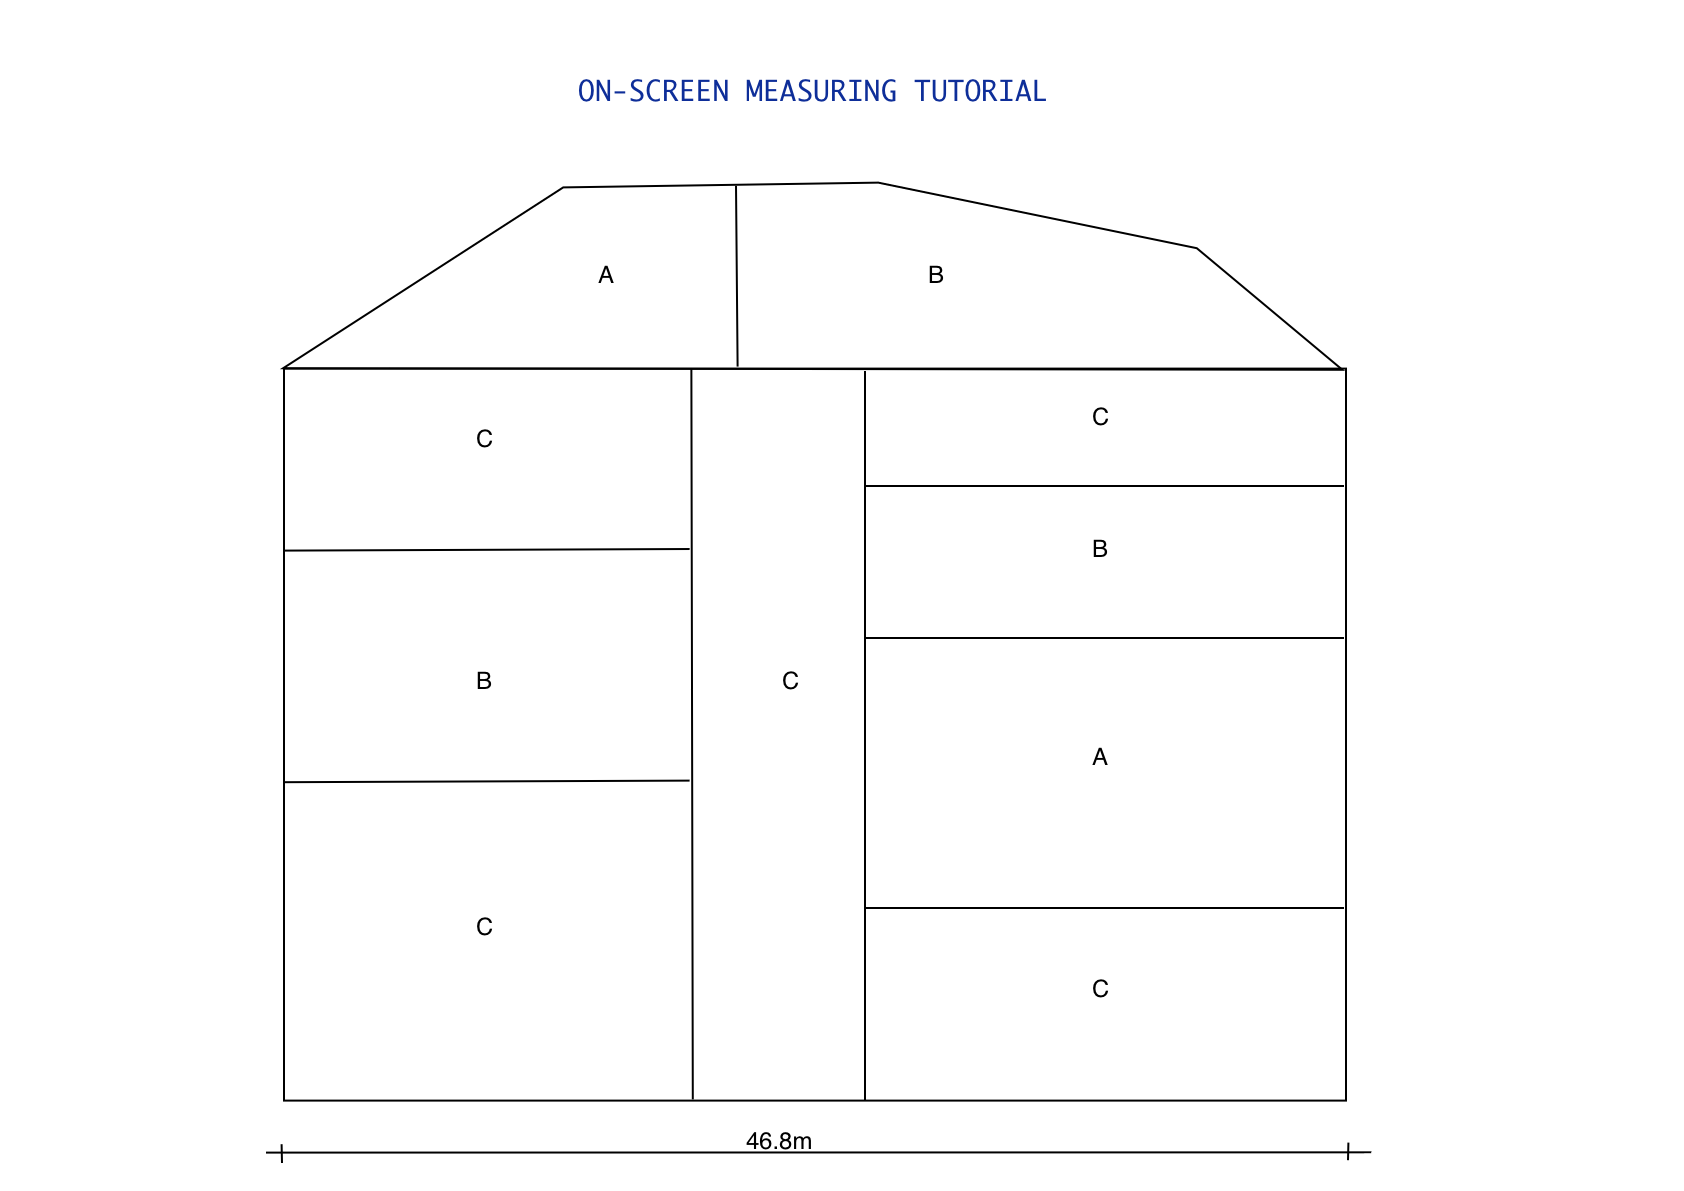
- Importantly, before
you can do any measuring, you will need to Scale the
drawing by Marking a known length on the drawing.
You must do this before the first measurement. - Click the Horizontal Scale button, then mark the first
and last points on the drawing between which you know
the distance.
In the example above, we would use the dimension 46.8 by clicking on the left and right endpoints of the dimension. - You are now asked to 'Enter the marked length'; for
the above example '46.8'
The program will now calculate the 'SCALE' for the drawing and show it in the Control Panel in the top right of the measuring screen.
The horizontal and vertical scales will be both set the same when you click the 'Hor...' button, and the vertical only will be set when you clcik the 'Ver..' scale button.
You can reset the scale at any time by clicking the 'Scale' buttons in the Control Panel and redoing the process.
This scale is now stored in the drawing information, and will not need to be reset unless the drawing is subsequently placed onto a different monitor. - We can now start our measurments.
Each time a measurement is taken, the measure will be entered into the currently selected cell of the current workupsheet
If the worksheet is a Quantity worksheet, any comments will be placed into the 'COMMENTS' column. If the worksheet is not a Quantity worksheet, the comments and a preceding ';' will be added to the end of the measure. This will be highlighted later. - Firstly, lets measure the areas for each of groups A B
and C
In this example, we will demonstrate this in an Estimate Worksheet - Open any Estimate Worksheet
- As we have not as yet used the above drawing in this Project before, we need to Import it
- Press the CTRL+ENTER key combination to start the process
- Click the 'Import' button to import a new Drawing
- Navigate to the appropriate drawing and Open it
- Immediately click the 'HScale' button and 'Mark a
known length' to ascertain the scales of the drawing
In this case we click the two end points of the dimension '46.8' . - 'Enter the Marked Length' = 46.8
- The Control Panel now shows the 'Scale'
- We now start measuring the Areas for the 'A' group
- Firstly, we will add the item for group 'A' into the Estimate Worksheet
- At the moment our drawing is 'Active' (receiving
keystrokes) so we need to make the Estimate
Worksheet 'Active'
Press 'CTRL+ENTER' - this moves you back and forth between the drawing and the Worksheet - Now type in the description = 'Group A areas',
UNIT = 'm2', and open up the Quantity Workup Sheet
It is important to note here that the 'Active' drawing is accessible to all relevant worksheets. - Now we will measure each of the Group 'A' areas.
- Measuring rectangular shaped areas is achieved by:
- Click the 'Rect' button in the Control Panel to signify that we will be measuring rectangular areas
- Type any annotation you might want for this measurement e.g. Rm 101
- Now click any two adjacent corners thus delineating the area
- The two side dimensions will be calculated and the expression 'width * height' will be entered into the worksheet at the current selected cell
- The appropriate area will be shaded on the drawing in the colour that is currently selected in the Control Panel
- Any annotation we made will be inserted into the Comments column
- The comments will be deleted ready for the
next measurement
- Repeat items 2 and 3 above for each subsequent
rectangular area
OR IF THE RECTANGLE IS BOUNDED BY AN UNBROKEN LINE
- Type in any annotation you wish
- click inside the area to be calculated WHILE holding down the ALT key
- Now Add a TAG if you want
A TAG is your label for a measurement, and it is shown centrally over the measurement. In Drawing Preferences (we discusss this later) you can make the program request the TAG after each measurment automatically.
You can manually Edit/Add a TAG to an existing measurement by RIGHT-Clicking on the measurement, and choosing the option to Add/Edit the TAG from the popup menu. - Measuring irregular shaped areas is achieved by:
- selecting the 'Area' button in the Control Panel
- typing in any annotation we wish
- clicking each corner point on the shape's
perimeter and then 'double-clicking' on the last
point to signal we are finished
For curved sections on the shape's perimeter, click around the curve at small intervals - the smaller the interval the more accurate the area calculation will be. - Double click on the last point to complete the marking of this shape
- The entry in the worksheet for this irregular shape will be one - the calculated area

OR IF THE SHAPE IS BOUNDED BY AN UNBROKEN LINE
- type in any annotation you wish
- click inside the area to be calculated WHILE holding down the ALT key
- When we have finished measuring the areas for Group 'A', close the Quantity Worksheet
- Now for the next group of areas - Group 'B'
- Type in the description and unit in the Estimate Worksheet
- Open up another Quantity Workup Sheet
- Press the 'CTRL+ENTER' key combination to 'Activate' the drawing again
- Measure the areas as before
Maybe you want to change the 'shading' colour for these. Do this by clicking the 'colour' button and select the desired colour - If you make a mistake, then any measurement on the
drawing can be removed by RIGHT clicking on the
'marking'. If it located the measurement, then a Popup
will appear asking you to select yes or no to remove
it.
NOTE: This only removes the marking from the drawing - you will need to manually remove the corresponding entry in the worksheet - The same process is repeated to make length measurements
- When finished with a drawing, Click the 'Change Drawing' button to select a different drawing
Constant Width Depth or Factor
Certain circumstances require repeatedly measuring lengths and/or areas and applying a constant width and/or depth and/or factor (No. of) to these measurements.
e.g. Concrete slabs of a constant thickness
Strip footings of a constant width and depth.
These circumstances are accounted for by:
- clicking the expose constants button in
the Control Panel
This opens up three text fields for width depth and factor as shown below:
- enter the width and/or depth and/or factor dimensions for each
- measure the items in the normal manner
When a measure is made the measure will be - if in a Quantity Workup Sheet
the measure is placed in the DIM1 column
the width if specified in the DIM2 column
the depth if specified in the DIM3 column
the factor if specified in the FACTOR column
the comments in the COMMENTS column - if not a Quantity Workup Sheet
the measure will have each of the width and depth appended with an '* and the dimension
the ';' and comment is then added to the result if the comment has been specified
the final constructed measure is then placed in the current active cell of the Parent worksheet to this drawing
Drawing Preferences
Configure some of the behaviours of On-screen drawing by clicking the drawing
preferences button in the Control Panel.
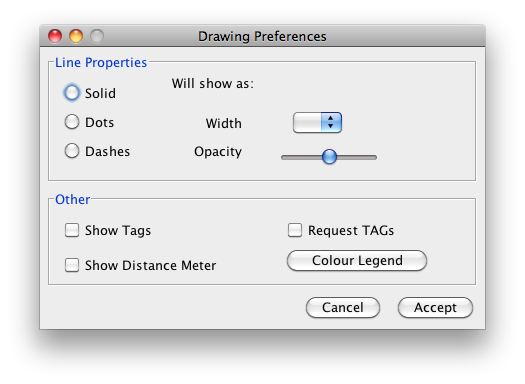
A dialog will appear as shown here:
Configure some of the behaviours of On-screen drawing by clicking the
drawing
preferences button in the Control Panel.A dialog will appear as shown here:
Line Properties
Choose the Line type
- Solid, Dots, Dashes - to represent length
measurements
Select the line width - 1 to 5 - by clicking on the combo box and selecting one from the list
Select the Opacity - slide to the left and the underlying image shows through more, to the right and the image shows through less
OtherSelect the line width - 1 to 5 - by clicking on the combo box and selecting one from the list
Select the Opacity - slide to the left and the underlying image shows through more, to the right and the image shows through less
Show Tags
If this is ticked,
then any TAGs that have been assigned to this
measurement will be shown.
You can Add/Edit any TAGs to an item by Right-Clicking on the measurement and choosing the appropriate option from the popup menu
Show Distance MeterYou can Add/Edit any TAGs to an item by Right-Clicking on the measurement and choosing the appropriate option from the popup menu
This is a small
window that appears in the top/left of the
drawing when this option is ticked.
Having marked the start of the meaaure, this window will display the distance along the X and Y axis of the current cursor position relative to the last mark made, as well as the Length between the two
Request TAGsHaving marked the start of the meaaure, this window will display the distance along the X and Y axis of the current cursor position relative to the last mark made, as well as the Length between the two
If this is ticked,
then each time a measurement marking is
complete, a Request Dialog will appear for you
to enter the measurement's TAG
Colour LegendClick this button,
and a dialog will appear enabling you to set up
a standard list of colours and a description of
what they represent
| TO DO THIS | DO THIS |
| Open a drawing for measuring | Open the worksheet to receive the measurments and Press CTRL+ENTER |
| Open a different drawing while measuring a drawing | Click the  button in the Control
panel and select from the appropriate file
navigator button in the Control
panel and select from the appropriate file
navigator |
| Annotate dimensions(Comments) | With the drawing Active, just start typing. If there is already a comment, the text will be appended to the existing. Press the Backspace key to delete the last character |
| Remove all the current comment | Press the CTRL+Backspace key |
| Measure lengths |
|
| Measure lengths progressively |
|
| Measure Rectangles |
|
| Measure irregular shaped areas |
OR
|
| Draw a Line |
|
| Draw progressive lines |
|
| Remove a marked measure or line | RIGHT+Click
on the marked measure then choose Delete
from the Popup Menu. NOTE: This only removes the marking - you must physically remove the corresponding entry from the worksheet as well |
| TAG a measure | RIGHT+Click on the marked measure then choose 'Add/Edit TAG' from the Popup Menu. |
| Activate the Worksheet from the drawing | Press CTRL+ENTER |
| Activate the Drawing from the Worksheet | Press CTRL+ENTER |
Quick Measure Guide
Here are the simple steps to start measuring:
Here are the simple steps to start measuring:
- Select the cell in the worksheet to receive the measurements
- Press the 'CTRL+ENTER' key combination
- Navigate to and select the drawing to measure off
- Set the drawing's scale (only necessary the first time)
- Do the measure
- Type in any annotation for the measure (comment)
- Click the radio button in the Control Panel of the type of measure
- Length
- Rectangle
- Area
- Select the colour you want the drawing to be marked in
- Do the measure
- Click the end points for length
- Click the adjacent corners for a Rectangular area
- Hold the ALT key down and click inside a
bounded shape for area
OR - Pregressively click around the perimeter of an unbounded area then double click on the last point for area